Introducing the Space Usage Timeline: Optimize with Precision

VergeSense is the industry leader in providing enterprises with a true understanding of their occupancy and how their offices are actually being used.
While RTO policies and collaboration needs are bringing people back to the office, occupancy rates aren’t as high as they used to be and people use meeting rooms and huddle spaces differently.
Many offices face “breaking points,” when workforce demands aren’t met by available space, space design layout, or mix of spaces. Organizations must balance two opposing forces:
- Too much space in their portfolios
- Not enough of the space that their workforces want to use
How can you optimize to ensure you’re supplying the right mix of spaces to meet workforce demands? The answer is hidden in space usage and availability data.
That’s why we’re excited to announce The Space Usage Timeline.
Make Data-Driven Decisions

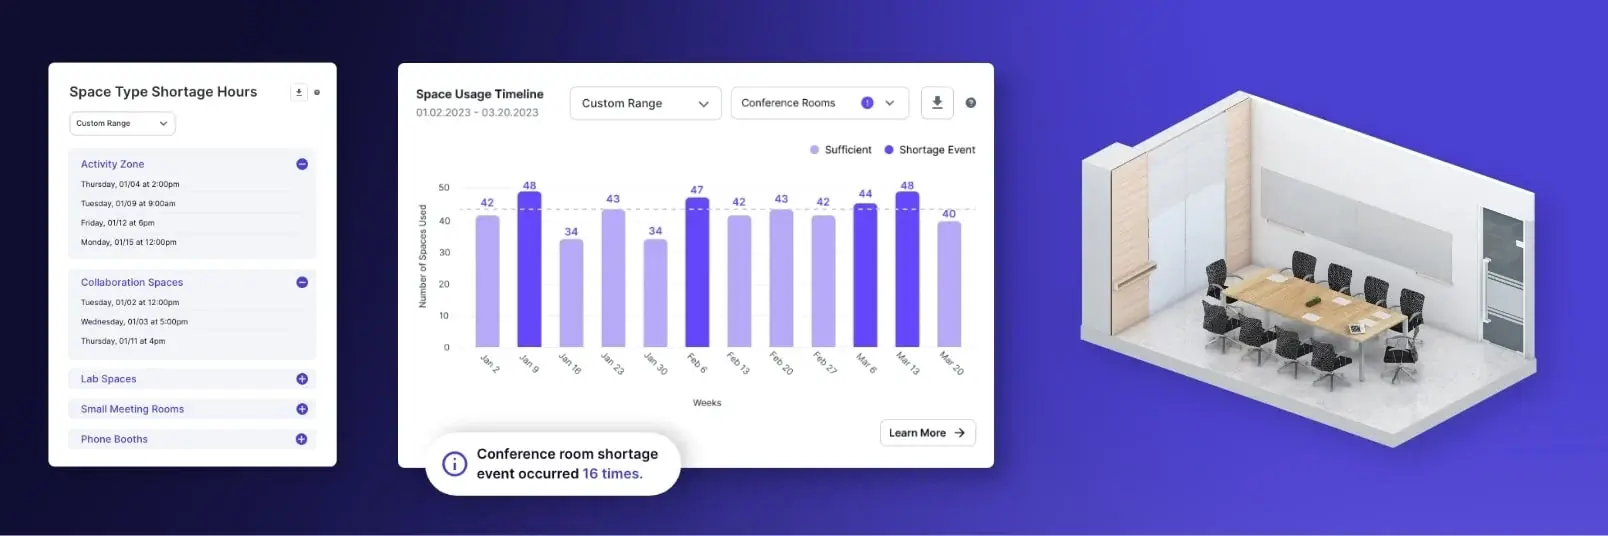
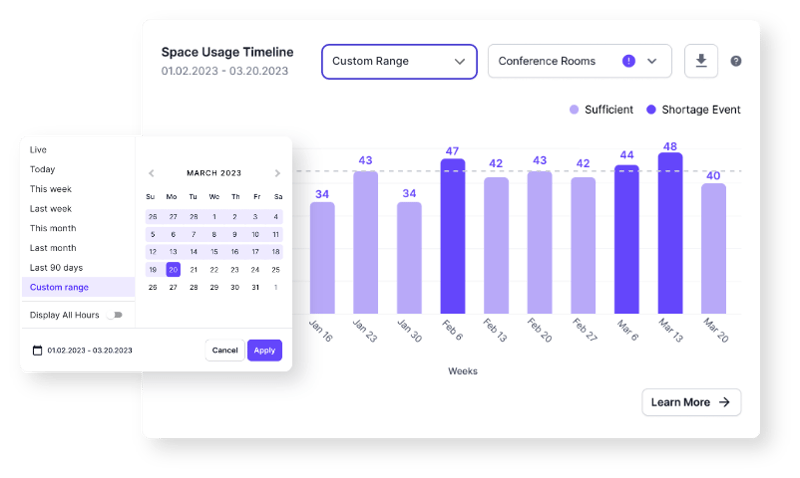
The Space Usage Timeline is a new feature of the VergeSense Occupancy Intelligence Platform that allows you to identify trends in space availability and space shortages to make more strategic space management decisions. The Space Usage Timeline allows you to analyze the usage of space and availability through the lens of space types like buildings or floors over time, and allows you to identify space shortages within any given time frame.
One of the biggest challenges organizations face today within breaking points is space shortages, where supply of a specific space type doesn’t meet demand. With the Space Usage Timeline, you can identify when more than 80% of a particular space type is being used within a given location and space type, down to the hour, allowing you to flag these shortages. This capability can be used to both pinpoint these shortages, and to provide data to inform space repurposing decisions.
By leveraging the Space Usage Timeline, you can use real data to design spaces, plan neighborhoods, and ensure spaces are always available:
- Identify availability trends and shortage events: View space usage and availability by building, floor, and space type in one central place. Uncover availability trends, shortage events, and make data-driven decisions.
- Pinpoint the specific times, locations, and space types where breaking points occur: Uncover specific times of peak use and shortages by sorting and analyzing data down to the hour. Identify trends across weeks and months to find the shortages that create breaking points in specific offices.
- Compare space types, floors, and buildings side by side: Examine space usage and shortage events across space types, floors, and buildings. Pinpoint the space types that are in high demand but short supply, and use data to make better management or repurposing decisions.
The Space Usage Timeline allows you to back major office decisions with real data, and create a seamless workplace experience that aligns with employee needs and expectations. Whether you’re considering a redesign, or checking to see if your teams have enough space, the Space Usage Timeline is your decision support tool.
Optimize your Workplace with VergeSense
Data-driven decisions build successful workplaces, and the Space Usage Timeline unlocks insights hidden within your data to make better decisions and ensure you meet your employees’ needs . Interested in using data to identify space availability trends in your workplace? Learn more about the Space Usage Timeline.